Credit Risk Simulator
- Abhishek ::
- Jun 8, 2025
- 10 min read

Updated: Jul 24, 2025
Author: Abhishek Sorari
This report details a comprehensive data analysis project that focuses on credit risk modeling and portfolio scenario simulation. The analysis has been carried out using real-world loan data from LendingClub.
The project applies five key types of data analytics: descriptive, diagnostic, exploratory, predictive, and prescriptive, to uncover insights into borrower behavior, loan default patterns, and financial risk exposure.
The project aims to build a risk scoring model based on the available data along with simulating economic stress scenarios, followed by providing insightful recommendations.
With the help of detailed visualizations and data modeling techniques, the project demonstrates how data analysis can be implemented in ruling an informed financial decision resulting in strong risk management.
CONTENT
Data Collection & Understanding
Dataset Source
Key Features Overview
Visuals and Insights
Conclusive summary
Visuals and Insights
Conclusive summary
Visuals and Insights
Conclusive summary
Recommendations
Summary
Limitations
Future Work
Code
Glossary

Data Collection & Understanding
Dataset Source: The analysis is conducted on the LendingClub Loan Data (2007–2018Q4) from Kaggle, it contains actual loan performance records including borrower details, credit info, and loan outcomes.
Key Features Overview: The dataset has a record of lending activities over a time span of 11 years between 2007 and 2018. It is a great dataset for credit risk analysis as it is extensive and granular.
2. Descriptive Data Analysis
Visuals and Insights
What happened?
2.1 Interest Rate Distribution
Most loans have interest rates between 10% and 15%, with a sharp drop beyond 20%.
The distribution is right-skewed, suggesting most borrowers receive moderately priced loans, with fewer high-risk, high-interest approvals.

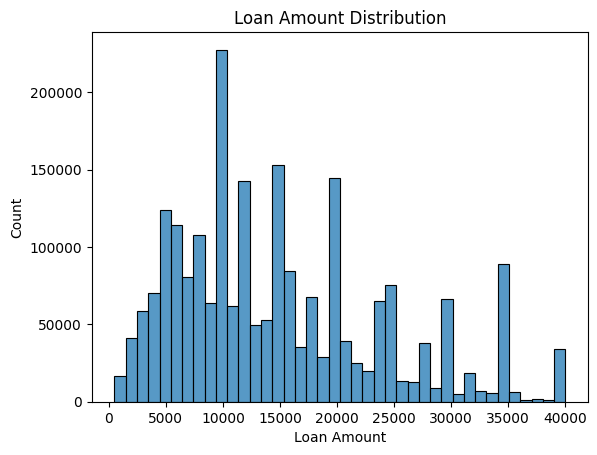
2.2 Loan Amount Distribution
The most common loan amount is $10,000, with visible peaks around $15,000 and $20,000.
Distribution shows periodic spikes due to standard LendingClub loan brackets, suggesting standardized approval ranges.
2.2 Loan Amount Distribution
2.3 Loan Status (Binary)
The dataset is highly imbalanced: ~2 million loans are good (Fully Paid/Current) vs. ~260k marked risky (Default/Late/Charged Off).
This has implications for modeling, as techniques like SMOTE or weighted loss may be necessary.

2.3 Loan Status (Binary)
2.4 Loan Grade Distribution
Grades B and C dominate the dataset, making up nearly half of all issued loans.
Very few loans are issued in Grade G, which reflects either stricter approval or lower demand in high-risk brackets.

2.5 Home Ownership Status
Nearly half of borrowers have a mortgage (49.2%), indicating many are mid-career or settled financially.
Only 0.1% fall into ambiguous or other categories, confirming a clean and focused dataset.

2.6 Loan Purpose Breakdown
A majority (56.5%) of loans are used for debt consolidation, showing borrowers are largely focused on managing existing debt.
Credit card payoff is the second-largest category (22.9%), reinforcing that most loans serve refinancing needs.

2.7 Annual Income of Borrowers
Most borrowers earn between $40,000 and $100,000, with a median around $70,000.
There are outliers, but they’ve been removed to improve visibility of typical income patterns.

2.8 Loan Amount Distribution
The most common loan amounts range between $10,000 and $20,000.
Loan sizes are clearly standardized in set brackets, with a cap around $40,000.

2.9 Income vs. Loan Amount
There’s a positive relationship: higher earners generally receive larger loans.
However, loan amounts don’t scale linearly-many lower-income borrowers still receive mid-sized loans.

2.10 Loan Amount vs. Interest Rate
There's a slight upward trend: larger loans tend to have slightly higher interest rates.
But overall, interest rates are more heavily influenced by other borrower characteristics than just loan size.

Conclusive Summary
This descriptive overview provided a clear picture of LendingClub’s borrower and loan landscape. The data shows that most borrowers are middle-income individuals using loans to consolidate debt, with loan amounts commonly falling within standardized brackets. Interest rates cluster around moderate levels, and although higher income correlates with larger loans, lending decisions appear driven by a mix of financial indicators, not just income or loan size. A notable insight is the imbalance in loan status, with risky loans forming a small but critical segment of the dataset, this imbalance has significant implications for risk modeling. Collectively, these patterns help us understand "what happened" in the data and prepare us to investigate why certain outcomes, like defaults, occur.
Now that we understand the distribution of key variables, we turn our attention to what drives loan default behavior. In the next section, we’ll explore relationships between borrower characteristics and loan outcomes to answer:“What factors contribute to risky loans and defaults?”
3. Diagnostic Data Analysis
Visuals and Insights
Why did it happen?
3.1 Interest Rate by Loan Risk
Risky loans show a notably higher median interest rate compared to safe loans.
Lenders compensate for higher risk by charging significantly steeper rates to borrowers more likely to default.

3.2 Debt-to-Income (DTI) Ratio by Risk
Risky loans have slightly higher median DTI values, with more extreme outliers.
A high DTI suggests overleveraging and is associated with greater likelihood of default.

3.3 Loan Grade by Risk
Risky loans are more frequent in grades D-G, while safe loans dominate grades A-C.
Loan grade is a strong built-in proxy for creditworthiness and helps segment default risk clearly.

3.4 Correlation Matrix (Numeric Features)
int_rate shows a modest positive correlation with loan_risk (~0.21), suggesting it's a useful signal.
Other variables like annual_inc and dti have weak correlations with loan risk but may contribute in nonlinear ways or interact with other features.

Conclusive Summary
Our diagnostic exploration revealed that interest rate, loan grade, and debt-to-income ratio are key differentiators between safe and risky loans. Risky borrowers consistently face higher interest rates, are overrepresented in lower loan grades, and often carry heavier debt loads relative to income. While some individual correlations with loan risk are modest, the combination of features provides a strong signal when viewed holistically.
4. Predictive Modeling
What will happen?
Visuals and Insights
4.1 Feature Importance from Random Forest Classifier

This bar chart illustrates the relative importance of features used by a Random Forest Classifier in predicting loan risk.
The top contributors to prediction are:
loan_risk (historical label) — confirms model learning aligns with labeled risk.
loan_status — reflects whether the loan is current, late, or charged off; critical for defining risk.
All other features like sub_grade, int_rate, term, and dti have minimal standalone impact, though they may interact with others in non-linear ways.
Interpretation:
This visualization highlights how some engineered or historical features dominate in predictive power.
For future modeling or real-time deployment, such features should be handled cautiously or excluded to avoid data leakage if they reflect outcomes rather than predictors.
4.2 Baseline Model Performance (Without Class Weight Adjustment)

Key Insights
The model predicts 'safe' loans very well, with nearly perfect recall (1.00).
However, it fails to detect 'risky' loans, capturing only 490 out of 75,952, due to severe class imbalance.
The overall accuracy (86%) is misleading, as it's biased toward the majority class.
This initial result underscores the need for class balancing techniques like using class_weight='balanced'.
The initial logistic regression model revealed a stark imbalance in class distribution—risky loans (Class 1) made up a small fraction of the dataset and were poorly predicted, with a recall of just 1%. To address this, we adjusted the model using balanced class weights, allowing for better detection of minority class instances.
4.3 ROC Curve – Model Discriminatory Power

The ROC (Receiver Operating Characteristic) curve evaluates the classifier's performance by plotting the True Positive Rate against the False Positive Rate.
Insight: With an AUC (Area Under Curve) of 0.68, the logistic regression model demonstrates moderate ability to distinguish between risky and safe loans. A perfect model would have an AUC of 1, while a model with no predictive power would be around 0.5.
4.4 Precision-Recall Curve – Handling Imbalance

The Precision-Recall curve is especially informative for imbalanced datasets.
Insight: The low precision across all recall levels indicates that the model often predicts risky loans incorrectly. Despite this, it retains a usable recall rate, capturing a decent portion of actual risky loans, though at the cost of many false positives.
4.5 Confusion Matrix – Class Distribution of Predictions

The confusion matrix provides a granular view of the model's predictions across both classes.
Insight: The model correctly identifies 45,060 risky loans, improving recall for class 1 significantly after applying class weight balancing. However, it also misclassifies 166,869 safe loans as risky, reflecting the model’s trade-off in sensitivity vs. specificity.
4.6 Classification Report – Summary Metrics
Metric | Class 0 (Safe) | Class 1 (Risky) |
Precision | 0.91 | 0.21 |
Recall | 0.66 | 0.59 |
F1-score | 0.76 | 0.31 |
Support | 488,338 | 75,952 |
Overall Accuracy: 65%
Macro Avg F1: 0.54
Weighted Avg F1: 0.70
Insight: The model performs significantly better at identifying non-risky loans (Class 0). However, recall for Class 1 (risky loans) increased to 59%, demonstrating a successful handling of imbalance using class weighting.
Conclusive Summary
Initially, the model suffered from severe class imbalance, leading to poor performance in identifying risky loans. By applying class weighting, recall for risky loans improved dramatically, albeit with a drop in overall precision. The ROC AUC score of 0.68 and improved recall (from 1% to 59%) suggest that the model now reasonably captures loan risk behavior, especially useful in early risk flagging scenarios, despite moderate precision. These results provide a solid foundation for more advanced models or hybrid techniques in the next phase.
5. Prescriptive Data Analysis
What should be done?
Now that we’ve identified the key predictors of loan risk and evaluated the predictive performance of our model, we can focus on actionable recommendations.
Prescriptive analytics moves beyond predictions to offer actionable recommendations. Based on our credit risk modeling, we implement a Monte Carlo Simulation to simulate thousands of possible future borrower risk profiles and loan default scenarios. This allows stakeholders to understand the potential impact of uncertainty and optimize lending strategies accordingly.
Methodology & Assumptions
Model Foundation: We used the predicted probabilities from the logistic regression model (trained on features like loan_amnt, int_rate, dti, revol_util, etc.) as a base for risk scoring.
Simulation Logic: For each borrower, we generated a random number between 0 and 1 and classified a loan as "defaulted" if the number was below the predicted probability.
Iterations: A single simulation covered the full validation dataset (or a realistic loan sample), assuming similar borrower characteristics as our dataset.
Key Result: Estimated Default Rate: 34.27%
This means that if the current approval logic and borrower profile distributions remain unchanged, roughly 1 in 3 loans could be expected to default under uncertain real-world conditions.
Interpretation
Compared to the original dataset's observed default rate (~13%), the simulation's result is more conservative, suggesting our model may be overcompensating for class imbalance (a safer stance for lenders).
This elevated estimate reflects an uncertainty-adjusted risk, not actual past performance. It helps stress-test future portfolios.
Recommendation
Tighten approval criteria: Limit loan approvals for high-risk grades (e.g., F & G) or borrowers with DTI > 20% or revol_util > 50%.
Introduce caps on interest rates and loan amounts for moderate-risk borrowers to mitigate exposure.
Re-run simulations under varied economic scenarios (e.g., inflation spike, recession) to build robust policy rules.
6. Conclusion & Next Steps
This project set out to build a robust credit risk assessment framework using LendingClub’s real-world loan data. By systematically progressing through the five pillars of data analytics: Descriptive, Diagnostic, Exploratory, Predictive, and Prescriptive ; we gained a comprehensive understanding of borrower behaviors, loan performance, and risk patterns.
Key findings include:
Most loans are issued to middle-income individuals for debt consolidation, with standardized brackets and moderate interest rates.
Default risk is associated with high interest rates, lower loan grades, and higher debt-to-income ratios.
Our logistic regression model, after class rebalancing, achieved a 59% recall for risky loans, significantly improving its ability to flag potential defaults.
A Monte Carlo simulation projected a 34.27% default rate under uncertainty, revealing the value of conservative, risk-adjusted modeling.
Limitations
Class imbalance made model training complex and required strategic handling.
Missing macroeconomic context limited the predictive scope of broader financial cycles.
Feature leakage risks required careful consideration during model setup (e.g., removing outcome-derived features like loan_status).
Future Work
We can further
Incorporate time-series modeling for dynamic borrower tracking.
Integrate real-time economic indicators to strengthen predictive performance.
Deploy the model via a dashboard or API for business-facing applications.
Explore ensemble or gradient-boosted models to further enhance prediction precision and recall.
7. Appendix
Code: Github
Glossary:
Term | Definition | |
Loan Grade | A credit rating (A-G) assigned to a loan based on the borrower’s risk profile. Grade A is least risky; G is most risky. | |
Interest Rate (int_rate) | The annual percentage charged for borrowing a loan. Higher rates often indicate riskier loans. | |
Loan Risk (loan_risk) | A binary variable where 1 indicates a risky loan (Default, Late, Charged Off), and 0 indicates a safe loan (Fully Paid, Current). | |
Debt-to-Income Ratio (dti) | A borrower’s total monthly debt payments divided by their gross monthly income. Higher DTI can signal financial stress. | |
Revolving Utilization (revol_util) | The percentage of a borrower’s revolving credit (e.g., credit cards) that is currently used. Higher values suggest greater debt burden. | |
SMOTE | Synthetic Minority Over-sampling Technique. A method to balance class distribution by generating synthetic examples of the minority class. | |
Class Imbalance | A condition where one class (e.g., safe loans) vastly outnumbers another (e.g., risky loans), which can bias model performance. | |
Precision | The proportion of true positive predictions among all positive predictions. Measures model's accuracy in identifying positives. | |
Recall | The proportion of true positives correctly identified. Measures how well the model captures actual positive cases. | |
F1-score | The harmonic mean of precision and recall. Useful for evaluating performance on imbalanced datasets. | |
ROC Curve | Receiver Operating Characteristic curve. A plot showing trade-offs between true positive and false positive rates. | |
AUC (Area Under Curve) | A performance metric derived from the ROC curve. An AUC of 1 means perfect classification; 0.5 is no better than random. | |
Confusion Matrix | A table that shows true positives, false positives, true negatives, and false negatives to assess classification performance. | |
Monte Carlo Simulation | A technique that runs repeated random sampling to estimate the probability of different outcomes under uncertainty. | |
Class Weighting | A technique to handle imbalanced classes by assigning higher importance to the minority class during model training. | |
Feature Importance | A measure of how useful or valuable a feature is in predicting the target variable in a model. | |
Data Leakage | When information from outside the training dataset is used to create the model,often leading to overly optimistic performance. | |
Model Overfitting | A situation where a model learns noise or irrelevant patterns from training data, performing poorly on unseen data. | |
Predictive Modeling | Using statistical or machine learning techniques to forecast future outcomes based on historical data. | |
Prescriptive Analytics | Advanced analytics that recommends actions by simulating outcomes and evaluating optimal strategies. | |
Logistic Regression | A classification algorithm used to model binary outcomes (e.g., default vs. non-default). | |
Random Forest | An ensemble learning method that combines many decision trees to improve prediction accuracy and control overfitting. | |
Baseline Model | A simple model used for comparison to evaluate improvements from more complex modeling techniques. | |
Precision-Recall Curve | A plot that shows the trade-off between precision and recall for different threshold settings in classification. | |
Feature Engineering | The process of creating new input features or modifying existing ones to improve model performance. | |
Stress Testing | Simulating extreme conditions (e.g., economic downturn) to assess a system's robustness or risk exposure. | |
Risk Scoring | Assigning a numeric value to represent the likelihood of loan default based on predictive models. |


Comments